


Tarble exhibit transforms weather into art
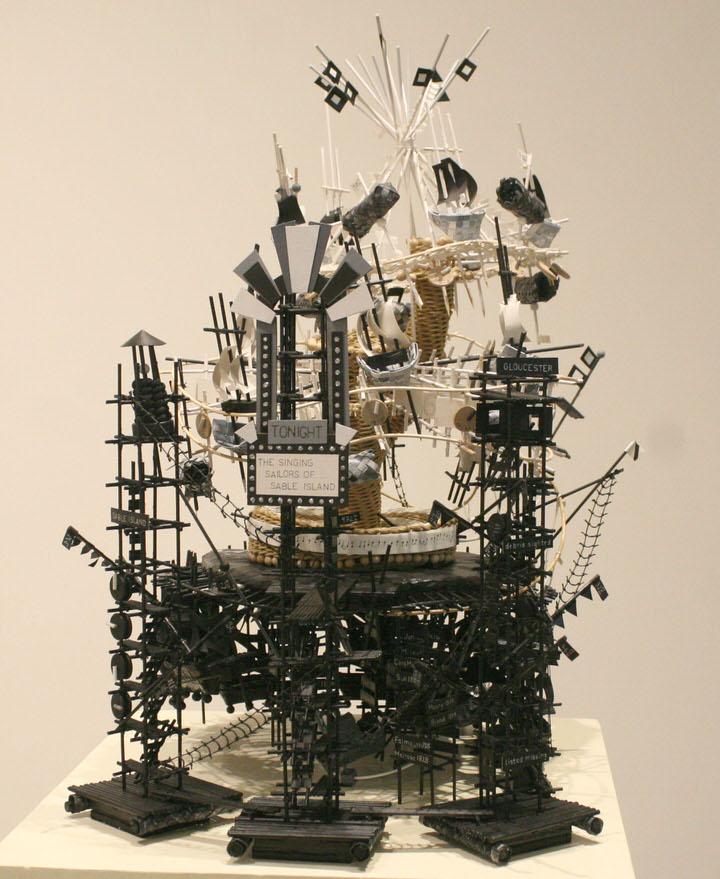
This piece, entitled “The Singing Sailors of Sable Island,” is one of several pieces in graduate student, Nathalie Miebach’s, art exhibit on Thursday at the Tarble Arts Center.
April 9, 2015
Nathalie Miebach turns weather into art in the “The Weather’s Getting Weird” exhibit currently on display at the Tarble Arts Center from Friday to May 20.
Miebach does not just interpret the weather and turn it into art; she uses different materials to turn actual weather data into a 3D sculpture.
Miebach got her start by taking astronomy classes at Harvard University and then began taking basket-weaving classes.
“It sort of clicked in my head,” Miebach said. “Maybe that is how I can make this more three dimensional. So when we got to do a final paper, I handed in a sculpture instead of a paper.”
She said she started to use sculpture to address questions she had about science. She did her research on the weather and used basket weaving as a grid to translate numerical data.
“By assigning values to the vertical elements, I’m giving each pair of reeds an hour of the day,” she said. “The horizontal reeds — I’m translating when the moon rises and sets and when the suns rises and sets.”
Miebach said over time warps start to develop because the numbers create different forms.
“When I translate theses numbers into woven form, I don’t change the information for any kind of purpose,” she said.
Mieback said one of the reasons it takes so long to create the pieces is because she wants them to function within a scientific context.
“I show my work in science museums and science labs so they have to function in that way,” she said. “You can’t veer too far from the actual information or because it becomes just an interpretation.”
All of her artwork has meaning to it. The certain colors, materials and labels represent something.
“There’s a dimensionality in numbers that you can reveal by translating that into another medium,” Miebach said. “It almost becomes a three dimensional data chart.”
Miebach’s work is intricately designed by using paper, wood and weather data to tell the story of a storm. Some pieces are small, while others take up the majority of the space of a wall.
One of her pieces, “Retiring Bob,” tracks Hurricane Bob as it moved along the East Coast. Parts of the piece actually move and show the viewer the path it took as made its way to Portugal. It includes a graveyard of names of the retired hurricanes.
Miebach also writes music scores using weather data.
“The score is basically just using three values; temperature, humidity and barometric pressures,” she said. “I’m literally just plotting what the averages are.”
She collaborated with musicians to compose a two-minute score, which is featured in her exhibit. Miebach also incorporates some of her musical scores back into her art.
Her pieces are shipped to and assembled at Tarble.
Garrett Goben, who graduated last semester and is a university employee for Tarble, helped in putting together the exhibit.
“It’s playful work and it’s really fun to look at,” Goben said. “Each color represents something. All the pieces are made up of weather data.”
While Goben assisted Miebach with her exhibit, he did not actually assemble if for her.
“What’s really funny about her work is that she’s really the only person that understands how it all goes together,” he said. “People send us shows, we assemble it and the artist comes in and tells us where to put it. But with Nathalie her work is so intricate that she had to come in and assemble everything alone and then we helped her out.”
Goben said her work is so intricate and complex that it is mind blowing.
“I’ve never really seen anything here at least in which artists use data or something that they can’t control to make their art,” he said. “These are basically weather graphs that are three dimensional and super interesting and fun to look at.”
Jalyn Westcott can be reached at 581-2812 or at jmwestcott@eiu.edu.